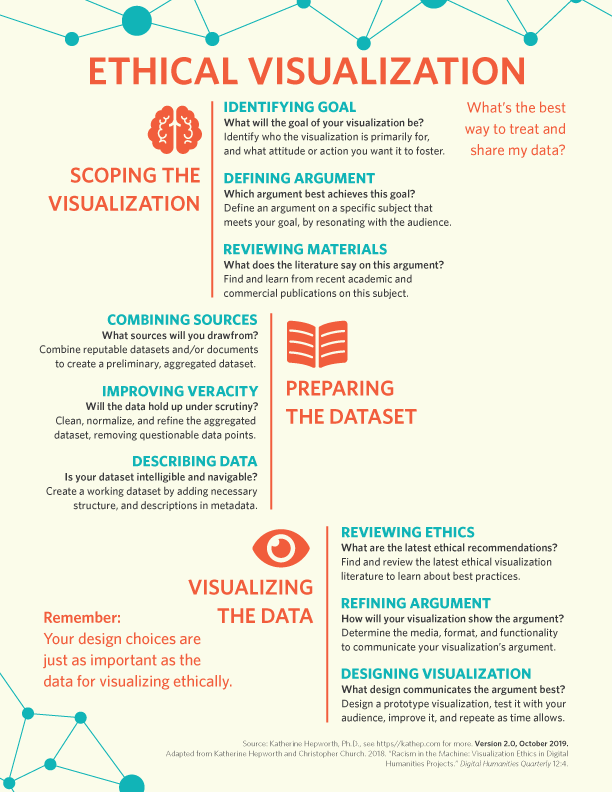
Ethical Visualization
A method for ethically visualizing data
Contents
Ethical Visualization
Details
Version: 2.0
Date: October 2019
About
First public release of the poster under CC-BY Creative Commons licensing. This version was influenced by conversations at and reflections on the MyDataGlobal conference in Helsinki, Finland, in September, and visits to Konstfact in Stockholm and Malardalen University in Eskilstuna, Sweden. Designing the poster also resulted in changes to the method. It was also influenced by insights gained while teaching Taming Treacherous Data at the Digital Humanities Summer Institute at the University of Victoria, Victoria, Canada.
Related writing
Download the poster here.
Related publication
Katherine Hepworth and Christopher Church. 2018. “Racism in the Machine: Visualization Ethics in Digital Humanities Projects.” Digital Humanities Quarterly 12/:4.
Credits
Created by Katherine Hepworth, Ph.D., see https//kathep.com for more. Version 2.1, October 2019. Adapted from Katherine Hepworth and Christopher Church. 2018. “Racism in the Machine: Visualization Ethics in Digital Humanities Projects.” Digital Humanities Quarterly 12:4.
Acknowledgements
Supporting organizations
The following institutions have supported work on this version.
-
University of Nevada, Reno
Institutional support: This version was supported by sabbatical leave and an Institutional Activities Grant.
Citation
Hepworth, Katherine. Ethical Visualization, Version 2.0. (2019). Intellectual contribution, text, and artwork by the author.
License

Ethical Visualization by Katherine Hepworth is licensed under a Creative Commons Attribution 4.0 International License.
Based on a work at https://kathep.github.io/ethics.
Permissions beyond the scope of this license may be available from personal correspondence with the author.