Ethical Visualization
A method for ethically visualizing data
Contents
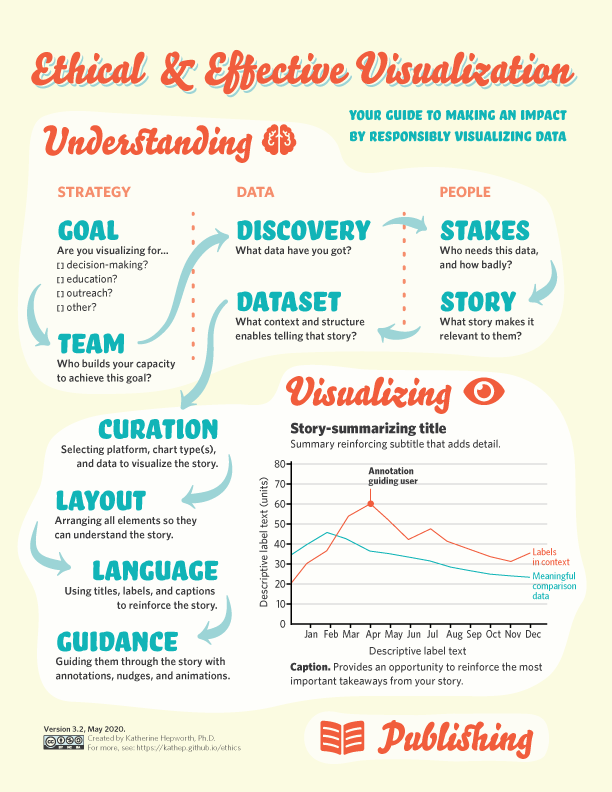
Ethical & Effective Visualization
Details
Version: 3.2
Date: May 2020
About
Third public release of the poster. Designing the poster also resulted in changes to the method.
Related writing
Make Me Care: Visualization Ethics in the Sciences and Data Sciences by Katherine Hepworth. HCII DUXU2020 Conference Proceedings
Ethical Design Recommendations for COVID-19 Visualizations by Katherine Hepworth and Amanda Makulec. Nightingale. PDF
Download the poster here.
The steps
1. UNDERSTANDING
1A. STRATEGY
What is your motivation to visualize?
- Formulate goal
Are you visualizing for…- education?
- outreach?
- dissemination?
- other?
-
Assemble a team
Who will help you meet that goal?Ethically visualizing data is a team effort, requiring multiple roles that have traditionally been associated with vastly different disciplinary traditions and siloes of knowledge. Four recommended roles outlined below. Some of these skill areas may be found in more than one person. One or more people may fill each role. The more recipients are involved in the process, the better.
- Audience
A person or people who from, or are as close as possible to, the intended audience(s). Co-creation is key to impact.
Includes: readers, participants, users and/or viewers - Data wrangler
A person with skill at cleaning, processing, and structuring data for visual display.
Includes: computer scientist, data analyst, digital humanist, and/or statistician - Subject expert
A person with in-depth subject expertise.
Includes: academic, community organizer, public official and/or scientist - Visual storyteller
A person with skill at ethically simplifying information and communicating it using visual means.
Includes: communication designer, game designer, graphic recorder, illustrator, and/or journalist
- Audience
1B. DISCOVERY
What data have you got?
-
Investigate through analysis
What can you find in the data using reason-led investigation? -
Explore through play
What can you find in the data using intuition-led exploration?
1C. STAKES
Who needs it and how badly?
-
Assess stakes
What is at stake in this visualization effort? -
Establish purpose
What is your motivation for sharing what you discovered in this data? -
Identify intended and unintended audiences
Who do you want your visualization to reach the most? -
Determine impact type
Which impact type will be most effective for your audiences?
1D. STORY
What story makes it relevant to them?
-
Empathize with audiences
What are your audiences’ greatest needs? -
Refine goal
What is the audience-oriented goal for the visualization? -
Create story
What kind of story best achieves this goal? -
Review narrative/framing literature
What does the literature say about this story?
1E. DATASET
How will you process and contextualize the data to tell that story?
-
Combine sources
What sources will you draw from? -
Improve veracity
Will the data hold up under scrutiny? -
Structure data
Is the dataset intelligible and navigable? -
Refine frame
How does the frame need to be adjusted?
2. VISUALIZING
What visual data curation best conveys your story?
2A. CURATION
What platform, chart type(s) and data will visualize your story?
-
Determine media context
What is the most appropriate media context for your story to reach your audience? -
Chooose chart type(s)
Which chart types tell your story effectively?
2B. LAYOUT
How can you arrange all elements so they can understand the story?
-
Design visualization
What design decisions will visualize the story effectively? -
Ensure legibility
-
Adhere to design principles
-
Enforce visual consistency
2C. LANGUAGE
How can you use titles, labels, and captions to reinforce the story?
-
Ensure readability
-
Test story
Does your visualization communicate the story to your audience?
2D. GUIDANCE
How can you guide them through the story with annotations, nudges, and animations.
-
Review visualization ethics literature
What are the latest ethical recommendations? -
Re-test story
Does your visualization communicate the story to your audience better?
3. PUBLISHING
Why should they trust you?
-
Release visualization
Will publishing base data do harm to any intended or unintended audience? -
Show process & affiliations
How can your ethical process be best demonstrated? -
Measure impact
What is the felt impact of your published visualization? -
Feedback results
How do the visualization’s intended impact and felt impact compare?
Acknowledgements
Contributors
The following people assisted with the work of developing this method. Their perspectives have led to the improvements outlined in the current version.
-
Georgina Rogers
Specific contribution: Discussion of ethical visualization; feedback on 3.1 from Make Me Care paper and poster. -
Sue Perks
at University of the Creative Arts, Epsom
Specific contribution: Feedback on 3.1 in Make Me Care paper; suggestion of checklist format. -
Wibo Bakker
Specific contribution: Feedback on 3.1 in Make Me Care paper. -
Judith Moldenhauer
Specific contribution: Discussion of ethical visualization; feedback on 3.1 in Make Me Care paper. -
Janice Baker
at University of Nevada, Reno
Specific contribution: Feedback on 3.1 in Make Me Care paper. -
Chelsea Canon
at University of Nevada, Reno
Specific contribution: Feedback on 3.1 in Make Me Care paper. -
Aya Sato
at University of Nevada, Reno
Specific contribution: Feedback on 3.1 in Make Me Care paper.
Supporting organizations
The following institutions have supported work on this version.
-
Office of Digital Humanities at the National Endowment of the Humanities
Institutional support: Awarded the Digital Humanities Advancement Grant for the project Ethical Visualization in the Age of Big Data: Contemporary Cultural Implications of Pre- Twentieth-Century French Texts. -
University of Nevada, Reno
Institutional support: This version was supported by sabbatical leave. -
College of Liberal Arts, University of Nevada, Reno
Institutional support: Co-funding the Planning Workshop 'Ethical Visualization in the Age of Big Data', which contributed to the intellectual progress represented in the current version. -
Reynolds School of Journalism, University of Nevada, Reno
Institutional support: Co-funding the Planning Workshop 'Ethical Visualization in the Age of Big Data', which contributed to the intellectual progress represented in the current version. This version was also supported by a Semenza Professional Development grant, which made possible professional development and teaching travel to DHDownunder in Newcastle, Australia, in December 2019.
Citation
Hepworth, Katherine. Ethical & Effective Visualization, Version 3.2. (2020). Intellectual contribution, text, and artwork by the author.
License

Ethical Visualization by Katherine Hepworth is licensed under a Creative Commons Attribution 4.0 International License.
Based on a work at https://kathep.github.io/ethics.
Permissions beyond the scope of this license may be available from personal correspondence with the author.